How to Calculate Restaurant Automation ROI from Savings
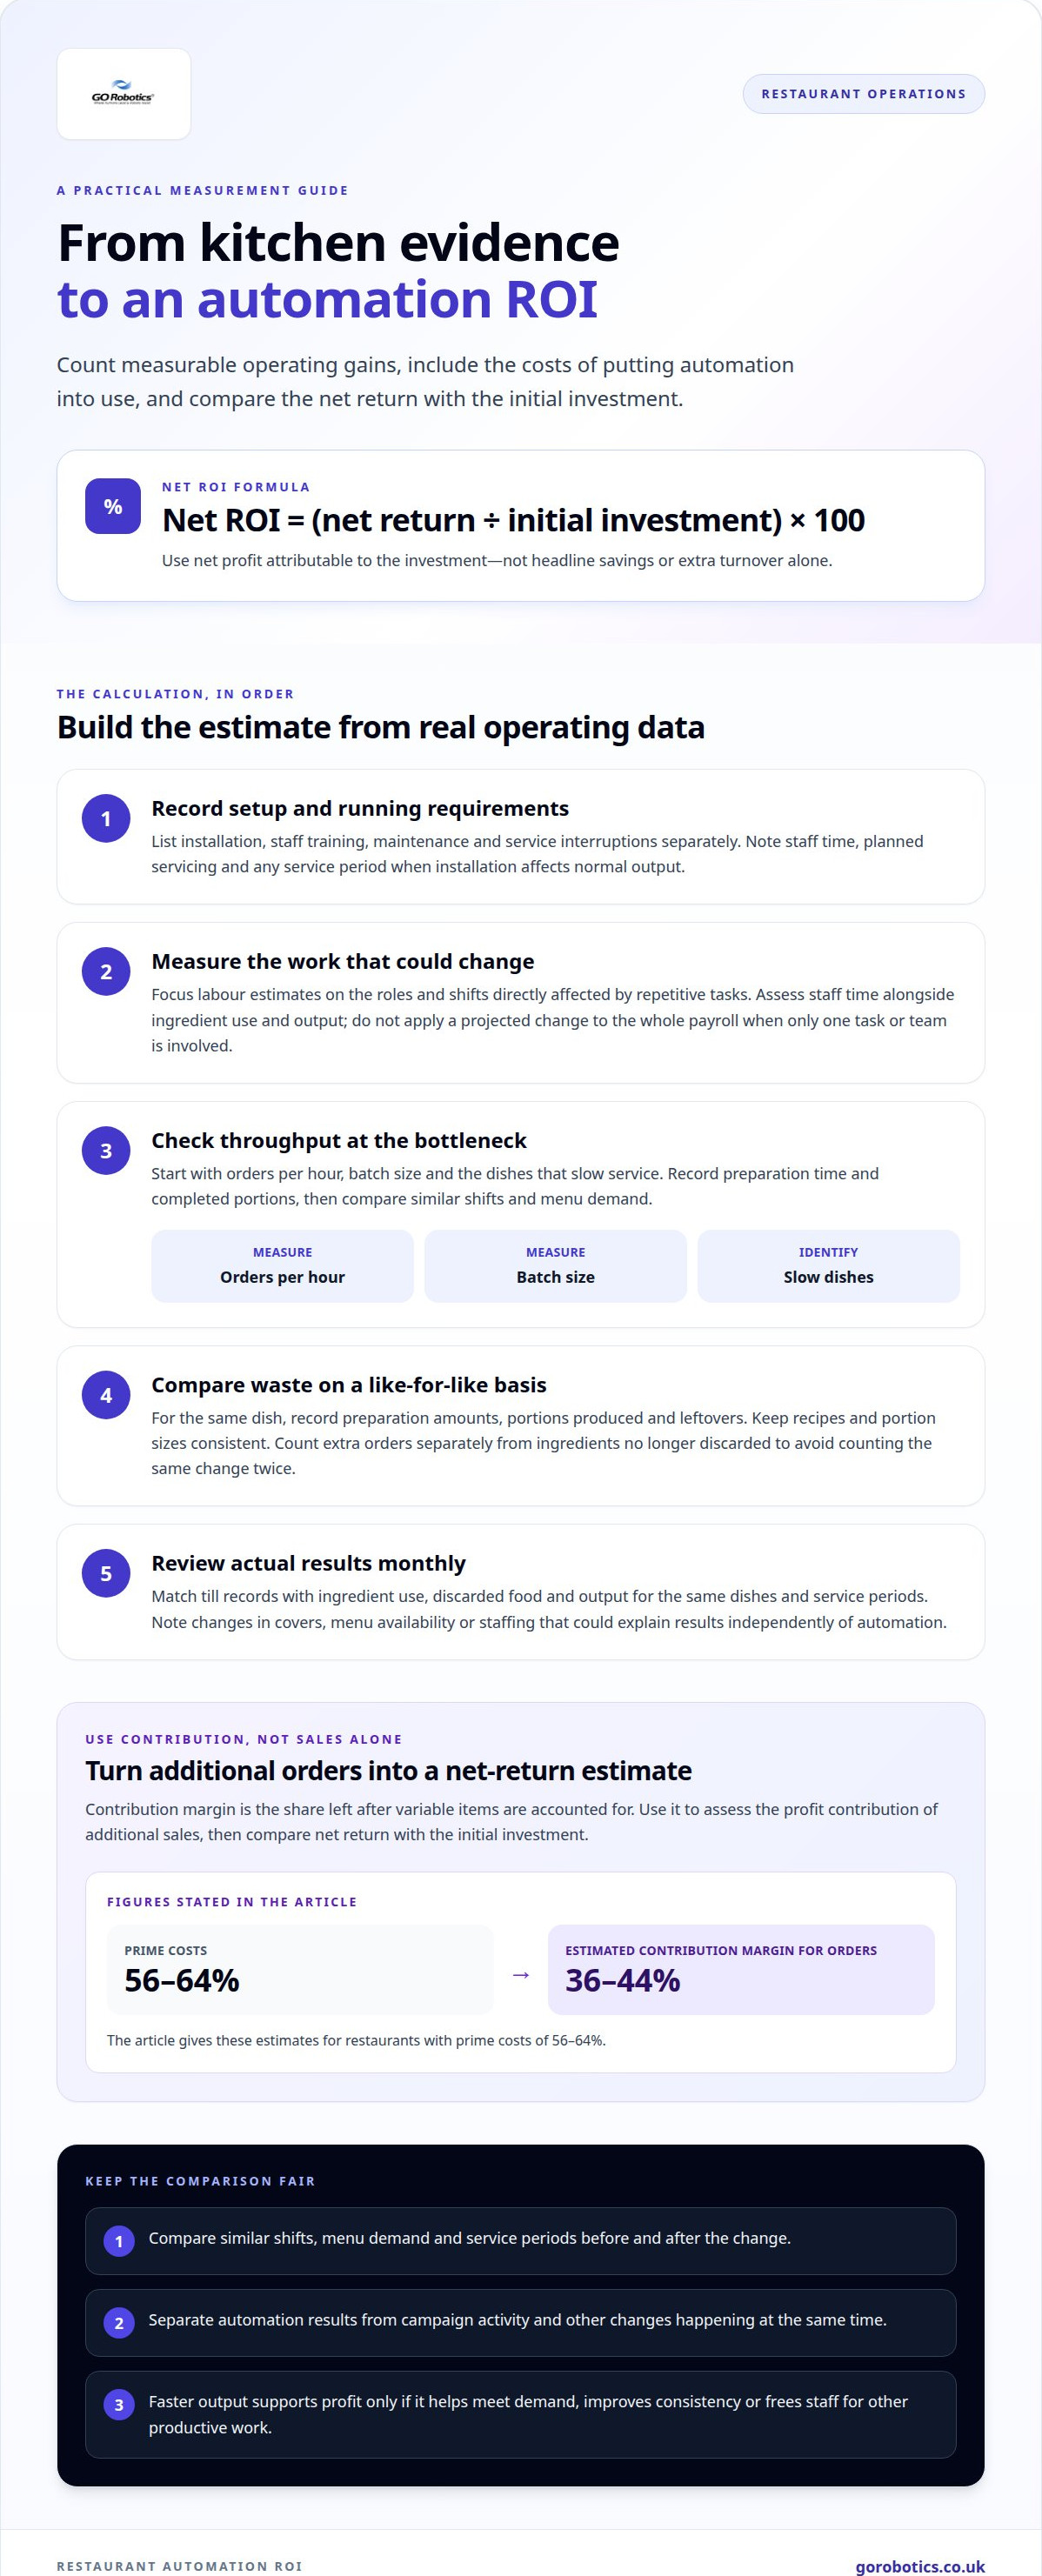
A restaurant automation investment should earn its place through measurable operating gains, not novelty. When calculating automation ROI for restaurants, compare the net profit attributable to the investment with the initial investment, then multiply by 100 to express the result as a percentage.
A useful calculation depends on the figures behind it. Separate measurable savings and added contribution from assumptions, and include the ongoing costs and requirements of the automation.
This guide explains what counts as a return and how to estimate the effects of reduced waste and improved throughput. You’ll learn how to assess which labour is directly affected, build a practical investment example and test how different assumptions change the result. The aim is to help you decide whether automation fits your restaurant’s day-to-day operation.
Key Takeaways
- Calculate ROI from net profit attributable to automation, not headline savings alone, and include the investment in the calculation.
- Account for installation, training, maintenance and downtime when assessing the full return.
- Estimate throughput changes using orders per hour, batch size and the dishes that slow service, then assess waste against real operating data.
- Base labour estimates on roles and shifts directly affected by repetitive tasks, and test how different assumptions change the result.
- See how GO Robotics’ Pudu BellaBot, Pudu KettyBot, Pudu CC1 and Pudu HolaBot may fit restaurant operations.
What counts as a return?
Restaurant equipment and software needs vary by model, configuration, venue and operating arrangement, so there is no single UK figure for calculating automation ROI for restaurants. Assess the return by comparing measurable operational gains with the investment.
-
Add hidden setup and running requirements
List installation, staff training, maintenance and service interruptions as separate inputs. Record which tasks need staff time, when planned servicing occurs and whether installation affects normal output. If setup takes a kitchen station out of use, for example, note the affected service period. This gives you a more realistic picture than considering only the equipment’s routine operation.
-
Apply the net return formula
Use net ROI = (net return ÷ initial investment) × 100. For a campaign, calculate incremental sales using contribution margin, the share remaining after variable items are accounted for, then compare the net return with the campaign’s initial investment. This distinguishes additional turnover from the portion that contributes to profit. Keep campaign activity separate from automation results when both happen during the same period.
-
Factor in prime costs and labour
Assess labour changes alongside ingredient use and output, rather than treating staff time as the only source of a return. Restaurants with prime costs of 56-64% have an estimated contribution margin of 36-44% for orders. For automation, focus on roles and shifts directly affected by repetitive work. Don’t apply a projected change across the entire payroll if only one task or team is involved.
- Measure Google Business Profile activity. Restaurants manually maintaining a Google Business Profile spend 4-6 hours per week on it. Track that time separately from automation tasks, then consider the profile’s contribution to visits. When done well, Google Business Profile can drive 15-35% of new-customer foot traffic for local restaurants. Compare attributable visits with your usual trading pattern, rather than crediting every new customer to the profile.
- Track campaigns against a baseline. Compare campaign-period sales with normal trading and account for contribution margin, discounts and promotional activity. Check whether additional orders are genuinely incremental or shifted from another day or channel. Review hidden gains over 12 months, including steadier output or reduced manager dependency. This broader view can capture changes that a short campaign window may miss.
Assessing throughput and waste improvements
Measure what changes on the kitchen floor, then connect those changes to completed orders and ingredient use. Orders per hour, batch size and bottleneck dishes are practical starting points.
-
Estimate gains from lower ingredient use
Track the ingredients used for a repeat dish against portions served, then compare actual waste before and after the process change. Record preparation amounts, portions produced and leftovers for the same menu item. Keep recipes and portion sizes consistent during the comparison, or a menu change could appear to be a process improvement. This gives you a clearer view of whether the revised workflow uses ingredients more consistently.
- Record throughput at the bottleneck. Log orders per hour, batch size and the dishes that slow service during peak periods. If a batch-cooked dish delays several orders, for example, record its preparation time and completed portions alongside the kitchen’s overall output. Compare similar shifts and menu demand: a quieter service can make throughput look better even when the process has not improved.
- Separate reduced waste from extra orders. Use production records, portions served and discarded ingredients to identify changes in waste. Compare ingredient quantities for the same number of portions, and note changes to preparation or storage routines. If more portions are served, count the additional orders separately from ingredients no longer discarded. This helps avoid recording the same operational change twice.
-
Measure efficiency-led profit improvement
Compare completed orders and preparation time before and after the change, then check whether staff time is redirected to other productive tasks. Faster output supports profit only if it helps meet demand, improves consistency or frees staff for other useful work. For a monthly view, account for quieter periods and changes in menu mix rather than treating a strong peak shift as typical.
- Review actual results monthly. Match till records with ingredient use, discarded food and output records for the same dishes and service periods. Note changes in covers, menu availability or staffing that could explain growth independently of automation. If you’re assessing a restaurant automation setup, review the operating requirements alongside the figures, so your estimate reflects the kitchen workflow being measured.
Calculator assumptions and limitations
Set a clear target for the decision, then test whether different assumptions change the result.
- Define the investment period and target. Choose whether the calculation covers a monthly view or the full operating period. Keep the target specific, such as reducing time spent on a repeat task or increasing completed orders during a busy service. A restaurant investment with a payback period under 2-3 years is usually defensible as a rule of thumb, but it is not a substitute for your own figures.
- Use only affected labour in the estimate. Identify the roles and shifts that automation would directly affect instead of applying an assumed saving to the entire restaurant payroll. Include time spent on repetitive preparation only if that task is part of the proposed change. Keep current staffing separate from any future schedule so you don’t count the same hours twice.
- Build conservative, expected and higher-impact cases. Change one assumption at a time, such as the number of orders handled or the amount of staff time redirected. Compare the effect of each case on monthly net benefit and payback. If a small change in order volume makes the decision look favourable, treat the result as sensitive to demand, not as a dependable baseline.
- Separate operational gains from marketing activity. A campaign may increase visibility and bring in extra orders, but those results do not automatically come from kitchen automation. Record the campaign period separately from the restaurant’s normal sales pattern. If a promotion and new equipment start together, for instance, attribute to the equipment only changes supported by operational records.
- Record exclusions alongside the result. Note which costs, service changes or demand effects the calculation leaves out, and explain why. A model that assumes full use on every shift may overstate returns if demand varies or the equipment handles only part of the menu. Keep these limits visible when comparing the estimate with actual results, then update assumptions as operating data accumulates.
Restaurant operations data used for estimates
Build the estimate from records tied to the tasks you’re assessing. A worksheet organised by role, shift and activity makes it easier to trace each figure to its source.
- Record affected work by role and shift. Note the staff roles involved, their tasks and the time spent on each activity. Keep shifts separate so a quiet daytime service isn’t averaged with a busy evening. This shows when the work happens and which parts of the operation an automated process could affect.
- Gather records for matching periods. Bring together rotas, task logs, order records and inventory information for the same dishes and service periods. A till report can show when orders arrive, while kitchen notes can show when preparation starts and portions are ready. Use records from the same period to avoid comparing different trading patterns.
- Describe the restaurant and its workflow. Capture the business type, country, menu, daily portions, peak-hour volume, operator count, kitchen size and target rollout timeline. Add the specific task being assessed, from preparation and batch cooking to dish output or cleaning. High-repeat dishes are useful examples because their routine can be tracked consistently across services.
- Connect digital reports with kitchen records. Use your ordering platform to identify order timing and menu demand, then match those records with preparation notes and inventory movement. A digital order timestamp alone, for example, won’t show when a dish was completed. Pair it with the kitchen’s records for a fuller picture of how work moves through service.
- Use a range when direct measurements are limited. Set lower, expected and higher scenarios for the operational change, and record the evidence behind each assumption. If you haven’t measured automation data, validate estimates during a demonstration or menu test. Assess the actual menu, cleaning workflow and peak-hour output instead of relying on a general description of the equipment.
- Keep a clear reporting trail. Store source reports, worksheet entries and later updates together. When new observations become available, compare them with the original records by role, shift and task. Note changes in menu, demand or staffing alongside the figures. This helps explain differences in results and lets you revise the estimate without losing the starting point.
Worked restaurant investment examples
Use worked examples to test your calculations before making an investment decision. Keep operating returns, tax treatment and pilot results distinct.
-
Account for VAT and tax allowances
Include the VAT treatment relevant to your business, distinguishing recoverable VAT from the amount that remains part of the investment. The annual investment allowance (AIA) is a UK tax relief that lets businesses deduct the full cost of qualifying capital assets in the year of purchase. Whether an asset qualifies affects the tax calculation, so keep this separate from operating ROI.
-
Run a pilot and measure returns
Choose a repeatable task or menu item, then record its output, waste and staff involvement before the pilot. During the pilot, use the same measures under comparable service conditions. A software report can help track activity, but pair it with sales and kitchen records. This helps distinguish operational changes from shifts in demand or staffing.
- Work through a simple investment example. One example pairs annual extra profit or savings equal to half the initial investment with an annual ROI of 50% and a payback period of 2.0 years. The calculation is straightforward: divide the annual net return by the investment for ROI, and divide the investment by net annual benefit for payback. Treat both outputs as dependent on the example’s assumptions.
- Keep pilot results tied to the task. If a machine handles a repeat dish, compare portions completed, preparation time and ingredient use for that dish. Don’t claim gains across the whole menu based on a limited test. Record interruptions and any training period, as these can affect how well the pilot represents routine service.
- Separate automation from marketing channels. If a campaign runs during the pilot, track its orders and visibility separately from kitchen output. For example, compare the campaign’s additional contribution with the operational result instead of counting the same extra orders twice. This keeps the ROI calculation focused on the investment being assessed.
For a restaurant-specific discussion of pilot measures and equipment fit, discuss an automation assessment.
GO Robotics
GO Robotics offers service robots that can be assessed against your restaurant’s tasks, workflow and return measures. Its Pudu BellaBot, Pudu KettyBot and Pudu HolaBot are options to consider when building an estimate around a defined operational need.
Start with the operational problem, not a preferred model. Describe the repeated task, when it occurs, who currently handles it and what measurable change would count as a return. GO Robotics surveys the site before recommending a model, helping match the equipment to your restaurant’s layout and working routine.
- Set a baseline for the task. Record the current process, including staff roles, handover points and demand periods. If the aim is to reduce time spent carrying items between areas, document the route and the work involved. This gives you a starting point for comparing the same activity after automation.
- Assess Pudu BellaBot against your workflow. Identify the restaurant task you want to evaluate, then agree on the evidence that would show a useful change. You might compare completed trips, staff involvement or interruptions during service. Keep the measure tied to that task rather than assuming the model affects every part of the operation.
- Use the same method for Pudu KettyBot. Match its proposed role to a repeatable process and record relevant conditions, such as route, timing and service pattern. This makes it easier to compare estimates with observed results and avoid attributing unrelated changes, such as a different menu or quieter shift, to automation.
- Include Pudu HolaBot in the assessment. Define its intended use in your venue before building the financial case. Note the workflow, staff touchpoints and outcome to measure, then include training, maintenance and operating requirements in the investment calculation. A clear task definition keeps the comparison focused on evidence rather than assumptions.
Contact GO Robotics to discuss your restaurant’s workflow, the measures you plan to track and which model may suit the task. It’s a practical next step towards an ROI estimate based on your own operating data.
Make your next decision with operating evidence
Turn your ROI estimate into a clear operational test. Decide which task matters most, what a useful change would look like and how you’ll assess the result alongside normal service demands. This gives your team a practical basis for deciding whether to proceed, adjust the plan or focus elsewhere.
Calculating automation ROI for restaurants becomes more useful when the technology is matched to a specific job, rather than chosen on novelty alone. GO Robotics offers Pudu BellaBot, Pudu KettyBot and Pudu CC1 for restaurants to consider as part of that assessment. The model choice should follow the work you want to address and the way your venue operates.
If you’re ready to discuss how to assess the fit for your restaurant, Discuss automation ROI with GO Robotics. A measured next step can help you make a more confident decision about what comes next.
Frequently Asked Questions
What is restaurant ROI?
Restaurant return on investment (ROI) compares the net benefit of an investment with the resources committed to it. It helps you judge whether a change creates enough financial value to merit a place in the operation. For example, extra sales count only to the extent that they add profit after related deductions. ROI is a comparison tool, not a measure of revenue or cash flow on its own.
Are the calculated savings guaranteed?
No. A savings estimate describes what may happen under stated operating assumptions; it does not guarantee a result. Actual outcomes depend on factors such as demand, staff routines, the tasks automated and how consistently the equipment is used. Treat a forecast as a decision aid. After implementation, compare recorded results with the original baseline and update the estimate when trading patterns or processes change.
How can I get a more personalised ROI analysis?
Base the discussion on your restaurant’s actual operation, not a generic example. Share the menu or task you want to assess, typical service patterns, kitchen layout and current workflow. GO Robotics surveys the site before recommending a model, so the discussion can consider how a robot fits your venue and the task. That context helps shape a more relevant estimate.
How is ‘Time Saved on Manual Tasks’ factored into the ROI?
First, record which manual tasks change and how staff time is redeployed. Time saved becomes a financial return only if it reduces an expense, avoids additional labour or supports work that contributes to sales or service. If a team member uses the time for another necessary task, record that operational benefit separately. Don’t count the same minutes as both a labour saving and added productive capacity.
Is ROI the only metric I should care about?
No. ROI provides a financial comparison but doesn’t show every effect on service or the team. Track measures suited to the task, such as completed deliveries, order delays, cleaning consistency, staff adoption and interruptions during busy periods. A restaurant may see a modest financial return alongside a useful improvement in service flow. Consider the measures together before deciding whether the change suits your operation.
Is the estimated ROI guaranteed?
No. An estimate is a projection, not a promise of future performance. It depends on inputs such as utilisation, task suitability, demand and operating requirements, which may differ from actual conditions. Where practical, use a pilot or menu test to gather evidence, then replace assumptions with observed results. This grounds the decision without treating a projected return as certain.
How do restaurants calculate automation ROI?
To calculate it, compare the net financial benefit attributable to automation with the resources committed, then express the relationship as a percentage. Include added contribution from extra sales and genuine reductions in operating expenses, while accounting for ongoing requirements. When calculating automation ROI for restaurants, link each claimed benefit to evidence, such as task records or sales data, rather than attributing every improvement to the equipment.
What should be considered when assessing restaurant automation ROI?
Include the requirements connected with introducing and operating the equipment. These may include installation, staff training, maintenance, software or service arrangements, consumables, energy and disruption during setup. Include downtime if it affects service or output. Separate one-off requirements from recurring ones, and keep tax treatment distinct from operating performance so the calculation gives a clear financial picture.