Restaurant table turnover: understand rates and improve flow
A fuller dining room doesn’t always mean better table turnover. Table turnover measures how often tables are occupied and vacated during a set period. Calculate the rate by dividing the number of parties served by the number of tables. Learning how to improve restaurant table turnover means smoothing the flow from bookings and ordering to dining and payment, without making guests feel rushed.
A slow handover can disrupt service, but pushing diners to leave too quickly can spoil their experience. The aim is to cut avoidable waiting, not hurry people through a meal.
This guide explains the difference between turnover rate and table-turn time, with a simple calculation to use during service. It also covers how bookings, menu choices and preparation can help your team plan ahead, keep service moving and assess performance across dining periods.
Key Takeaways
- Use reservation tools that reflect live table availability so your team can respond to cancellations and plan for expected guest numbers.
- Track turnover and table-turn time over the same service period to make comparisons meaningful.
- Review menu complexity and prepare popular items ahead of busy periods to reduce avoidable delays between ordering and serving.
- Compare performance by shift and dining period, then judge results against the pace and experience your restaurant aims to provide.
- Consider whether Pudu BellaBot could support your restaurant’s service flow as part of a wider review of table turnover.
1. Reservation management and real-time availability
Keep a live reservation record so hosts can see which tables are booked, occupied or ready. For example, if 15 tables are available for dinner, update their status as parties arrive, cancel or leave. That shared view helps staff make seating decisions from current information, rather than relying on separate notes that may no longer match the room.
A digital booking system linked to table status can help track occupancy and turn times. Record when each party is seated and when the table becomes available again. The host or shift lead can then review the service timeline and spot recurring gaps, such as tables sitting ready while a queue grows at the entrance.
Match each reservation to a table that suits the party, and leave enough time between bookings for the expected meal and clearing. A restaurant might set a 90-minute booking time before seating the next customers. Explain that limit during booking, and allow staff to adjust table allocation when a party’s needs or the service pace differ.
Online reservations also help managers estimate guest numbers before service. Use that forecast to plan table sections, prepare the booking list and brief the team on larger parties or special requests. If several bookings are due together, stagger arrival times where practical so the kitchen and front-of-house team can manage demand without a sudden rush of orders.
Customer relationship management (CRM) tools can keep relevant guest preferences alongside booking details. A note about a high chair or preferred seating area gives staff a clear preparation step before arrival. Keep notes useful and focused on service, and make sure the team knows where to find and update them after a visit.
When guests have finished eating but continue chatting, staff can clear finished items over separate visits instead of interrupting abruptly. If another reservation is waiting, explain the timing politely. Where bar or lounge seating is available, offer guests the option to move there, rather than making it a demand.
Balancing turnover with satisfaction means setting expectations clearly and keeping service attentive. A 90-minute booking should reflect the meal and occasion, not serve as a reason to rush guests through courses. Monitor comments and reviews alongside booking records, so a change that shortens waits doesn’t come at the expense of a comfortable dining experience.
Overbooking can leave arriving guests waiting if their promised table is still occupied. Pressuring diners to leave can also create a poor final impression and discourage return visits. Use live availability, realistic booking intervals and a clear waitlist process instead. If a table runs late, update the next party honestly and offer an alternative only when it is genuinely available.
2. What is table turnover?
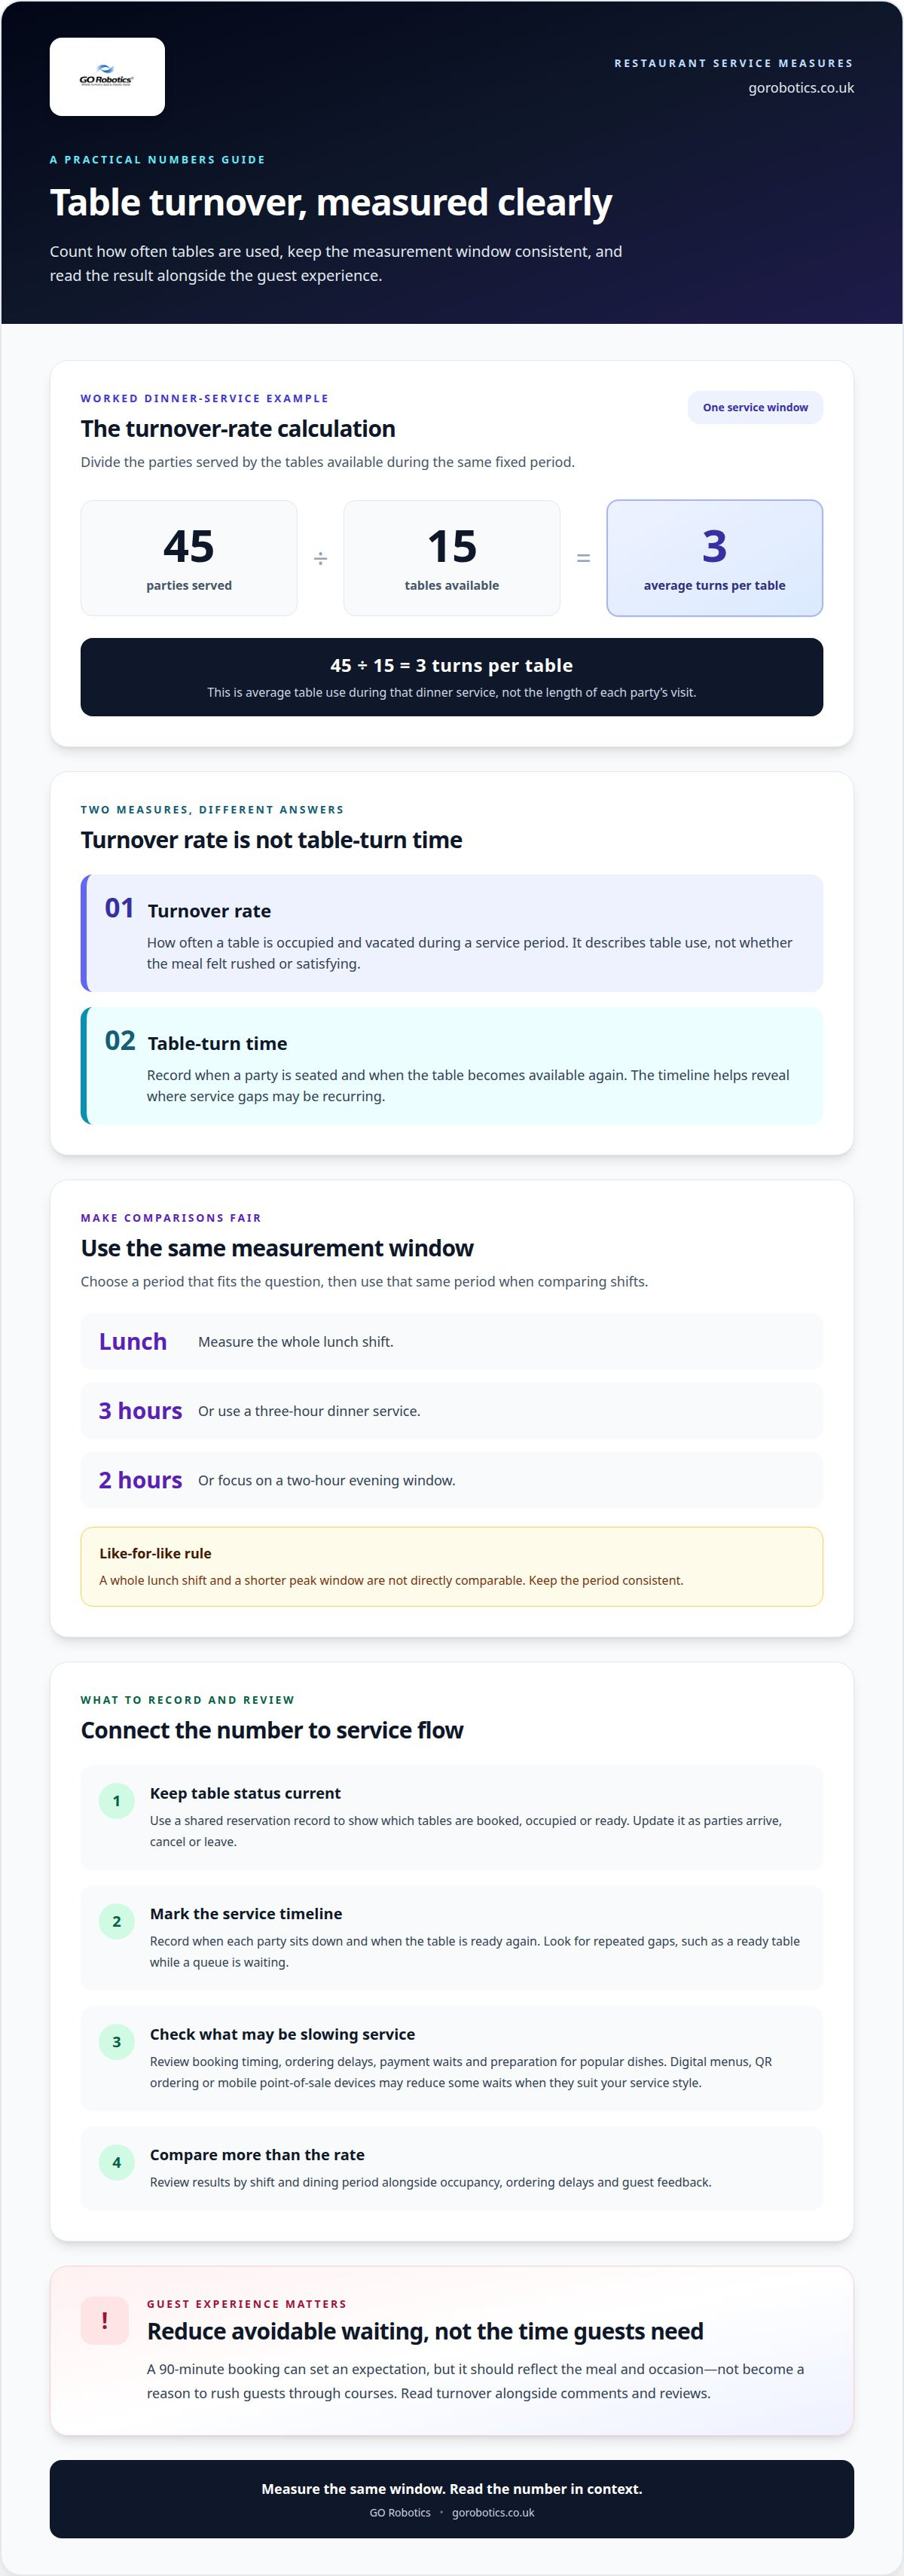
Table turnover tracks how often a table is occupied and vacated during a service period. A lunch party leaves, staff clear the table, and another party sits down: the table has served two sittings. This describes table use, not whether the dining experience felt rushed or satisfying. To assess performance, consider turnover alongside occupancy, ordering delays and guest feedback.
QR code ordering lets diners scan a code at their table to view the menu, order and pay by smartphone. It can reduce waits for a printed menu or a server to take each order. Restaurants can also update digital menus in real time, so guests see current dishes and availability rather than outdated information.
A digital menu gives diners time to browse before ordering, while staff remain available to explain dishes or answer questions. For example, a guest can review the menu after sitting down, then ask a server about an ingredient before choosing. Keep a printed menu available too, so guests who cannot or prefer not to use a smartphone can still order comfortably.
Mobile point-of-sale devices let staff take orders and settle bills at the table. Contactless payment can remove the wait for a card machine, while QR payment gives guests another option. For groups splitting a bill, digital payment can make the process clearer than passing one bill between diners.
Reservation systems and pre-ordering connect booking with kitchen preparation. Online reservations give the restaurant an estimate of expected guest numbers, helping managers plan staffing and prepare for likely demand. Where pre-orders suit the menu, guests can choose dishes before arrival, giving the kitchen an earlier view of upcoming orders.
Tableside ordering devices can also send orders directly to the kitchen through the restaurant’s point-of-sale system. Staff should check that each order reaches the right table and that changes, such as removing an ingredient, are recorded clearly. A short service trial can reveal whether the device reduces repeated trips or creates extra steps for the team.
Choose technology to suit your service style, not just to increase speed. A café with quick counter service may favour QR ordering, while a restaurant built around personal recommendations may use handheld devices to support staff. Keep a human option available, then review ordering delays, payment issues and customer satisfaction to see whether the change improves the experience.
3. Calculating table turnover rate
Calculate table turnover rate by dividing the number of parties served by the number of tables available during the same fixed period. If your restaurant serves 45 parties across 15 tables during dinner service, the calculation is 45 ÷ 15 = 3 turns per table. This figure describes average table use, not how long each individual party stayed.
Choose a measurement period that fits the question you want to answer. You might measure a whole lunch shift, a three-hour dinner service or a two-hour evening window. Keep the period consistent when comparing shifts; a lunch shift and a short peak window are not like-for-like measures.
For another example, serving 60 parties across 20 tables from 6 pm to 9 pm gives a rate of 3 turns per table. The calculation is 60 ÷ 20 = 3. Record the number of parties actually served, rather than the number booked, because cancellations and no-shows don’t represent occupied tables.
Average table-turn time answers a different question: how much service time corresponds to each turn? For a three-hour service, there are 180 minutes. Divide 180 minutes by the rate of 3, giving an average of 60 minutes per turn. Use the same service period for both measures, or the comparison won’t describe the same operating window.
Keep the calculation method consistent from shift to shift. Decide whether your table count includes every dining table available for service, and apply that rule each time. Record parties served and available tables for each period. If part of the dining room closes during service, note the change rather than comparing reduced capacity with a full-room shift without context.
A simple service record can include:
- Period: the start and end of the service being measured.
- Tables: the number available during that period.
- Parties served: completed sittings, rather than bookings alone.
- Turnover rate: parties served divided by available tables.
- Average turn time: total service minutes divided by the turnover rate.
Read the rate alongside service notes. A rate of 3 may reflect steady seating, or several tables turning quickly while others remain unused. Compare peak and quieter periods separately, then look for causes such as late seating, slow clearing or a bottleneck at payment. The figures help you balance table use with the pace your guests expect.
Once you have a consistent baseline, repeat the calculation after changing bookings, staffing or service steps. Where possible, compare the same days and service periods. This gives you a clearer view of whether the change improved flow, rather than relying on one unusually busy or quiet shift.
4. Menu design and preparation times
A menu affects how quickly guests choose and how smoothly the kitchen prepares orders. Review each dish’s ingredients, preparation steps and demand during busy services. If several dishes rely on the same bottleneck, such as one specialist station, orders can queue even when other kitchen areas have capacity.
Streamline the menu by removing dishes that add complexity without serving a clear purpose. A shorter menu can make choices easier and reduce the time servers spend explaining options. Group dishes under clear headings, describe key ingredients and make specials easy to spot before ordering.
Organise the menu to guide decisions without pressuring guests. A staff recommendation, set menu or taster menu can help diners compare fewer choices. During a rush, servers can mention dishes that take less time to prepare while leaving guests free to choose. This gives the kitchen a chance to balance its workload.
Preparation before service matters too. Identify popular sauces, portion ingredients and prepare suitable desserts in advance, following your usual food-safety procedures. For example, a pre-portioned dessert can be ready to serve without adding another task during the dinner rush. Keep a clear record of what is prepared and what needs replenishing.
Assess how menu changes affect kitchen speed, rather than judging them by appearance alone. Compare order patterns and kitchen ticket times across equivalent services. If a dish repeatedly holds up other orders, review its preparation steps, ingredients or place on the menu. A popular dish may still need a different workflow.
Before changing the full menu, test a small edit during a defined service period. Ask the kitchen team which dishes create the most pressure, then adjust their descriptions, grouping or preparation. Gather feedback from servers too: they can identify repeated questions that slow ordering and suggest clearer wording.
- Before service: prepare suitable popular ingredients and desserts in advance.
- During a rush: highlight quicker-to-prepare choices without limiting guest choice.
- After service: review ticket times and note dishes that create kitchen delays.
- At the next menu review: simplify confusing descriptions and assess complex, low-demand dishes.
Use waiting time as a practical signal. If guests regularly wait 15 minutes to decide or order, clearer menu descriptions and visible specials may help; reducing that wait to under 10 minutes can make service feel more responsive. Keep the focus on informed choices, not hurried decisions. A well-organised menu supports faster ordering while preserving the dining experience.
Finally, match menu preparation to the booking pattern. If reservations show many guests arriving together, brief the kitchen on expected demand and prepare suitable components ahead. This connects front-of-house planning with kitchen capacity, helping the team manage a busy seating without compromising consistency.
5. Table turnover and restaurant performance
A higher turnover rate can create more opportunities to serve diners, but it does not automatically mean higher profit. Compare turns with average spend, occupancy and guest satisfaction. If faster seating leads to rushed meals or complaints, the extra covers may not support the experience you want to provide.
For UK restaurants, useful starting benchmarks vary by dining style. Fast-casual restaurants and cafés may aim for 2 to 3 turns per table during a meal period. Casual dining may sit around 1.5 to 2 turns per service, while fine dining may see 1 to 1.5 turns per table.
Turn time differs too. A 60–75-minute sitting is one casual-dining reference point, while fine dining may take 90–120 minutes or longer. Treat these as comparisons, not fixed targets: menu style, party size and the pace guests expect all affect what suits your venue.
Review performance by shift, not just by day. Lunch and evening services may have different booking patterns, menu choices and staffing needs. Compare equivalent periods, then check whether slow turns resulted from late seating, kitchen delays, payment queues or tables waiting to be cleared.
Revenue per available seat hour, often shortened to RevPASH, adds another useful measure. Calculate it by dividing total revenue by available seat hours. It shows how effectively your seating capacity generates revenue over time, rather than treating every table turn as equally valuable.
Review each service using a simple process. Compare turnover and average spend across peak and quieter periods, then consider guest comments alongside the figures. For example, if lunch turns are quicker but guests complain about waiting to order, the issue may be service flow, not seating pace.
Dining-room layout also affects performance. A mix of table sizes can suit different party sizes and reduce empty seats, while rearrangeable tables help staff adapt to different services. Keep clear routes and accessibility in mind; squeezing in extra covers can disrupt safe movement and the dining experience.
Set a target that reflects your restaurant’s style, then assess it with satisfaction and revenue measures. The useful question isn’t simply whether tables turned faster, but whether the change helped diners and the business. Discuss restaurant service-flow options as part of your performance review.
GO Robotics: Pudu BellaBot
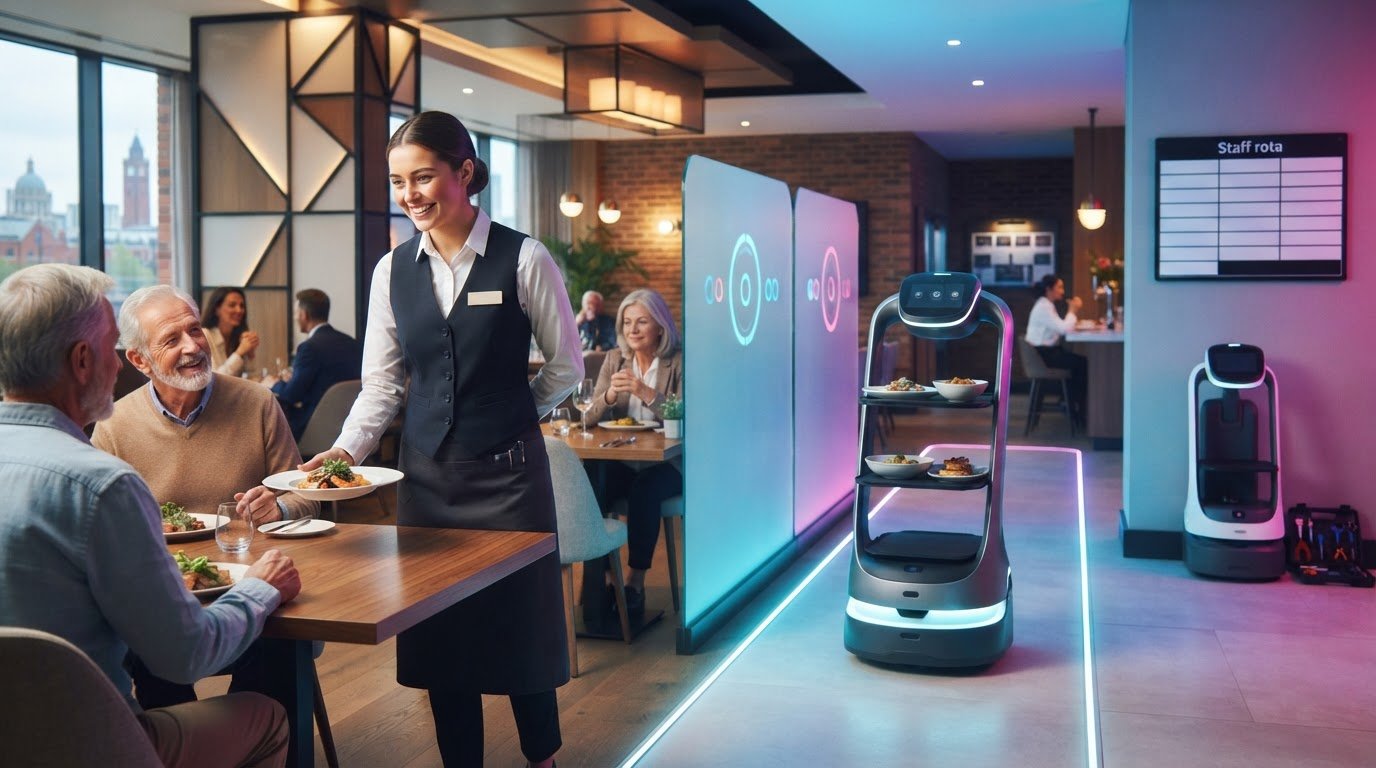
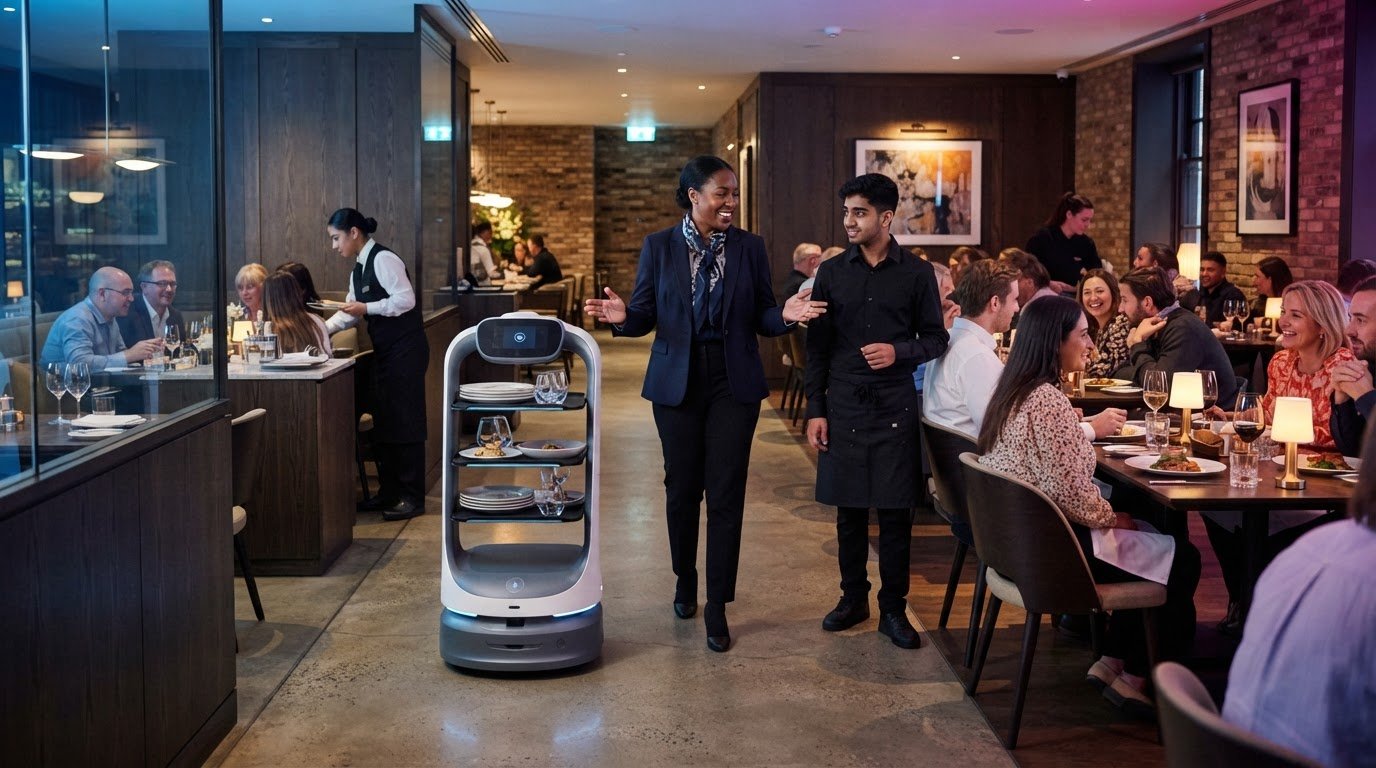
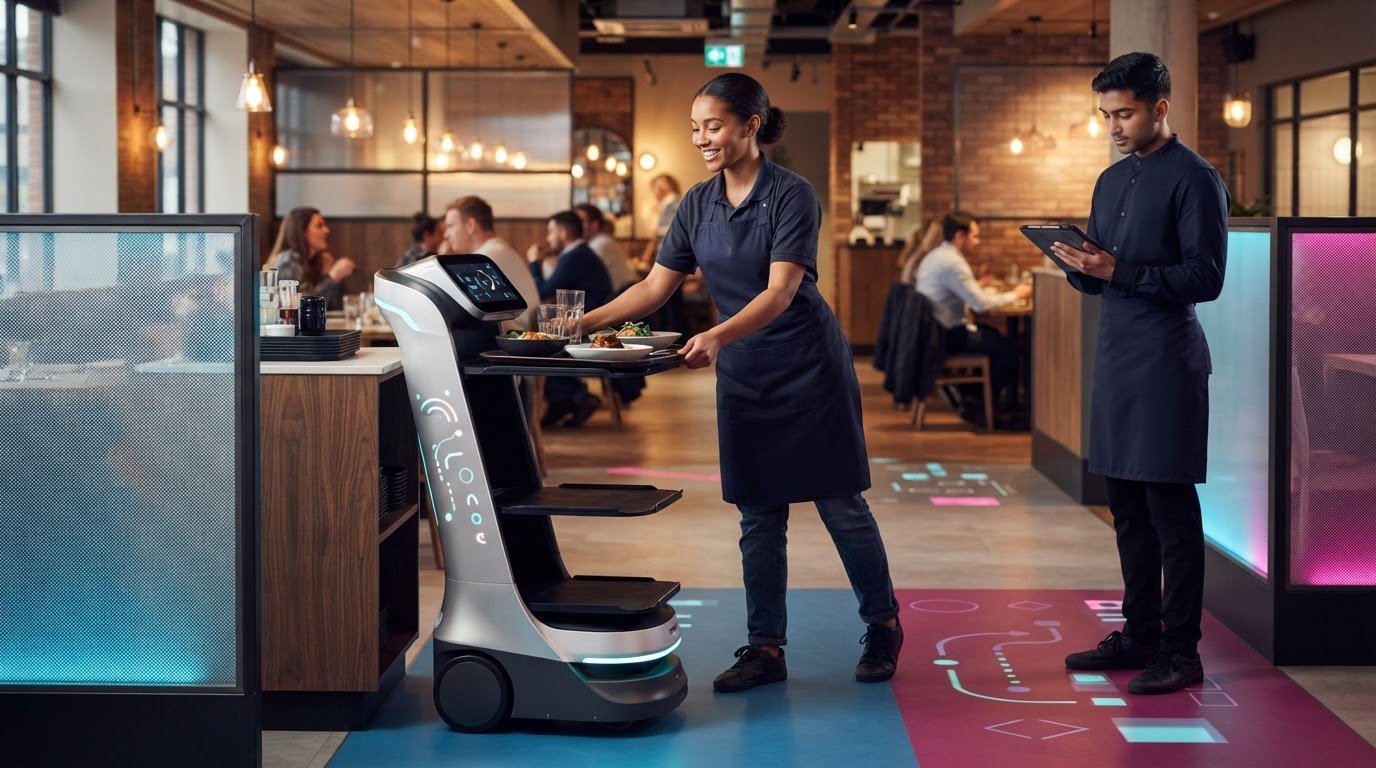
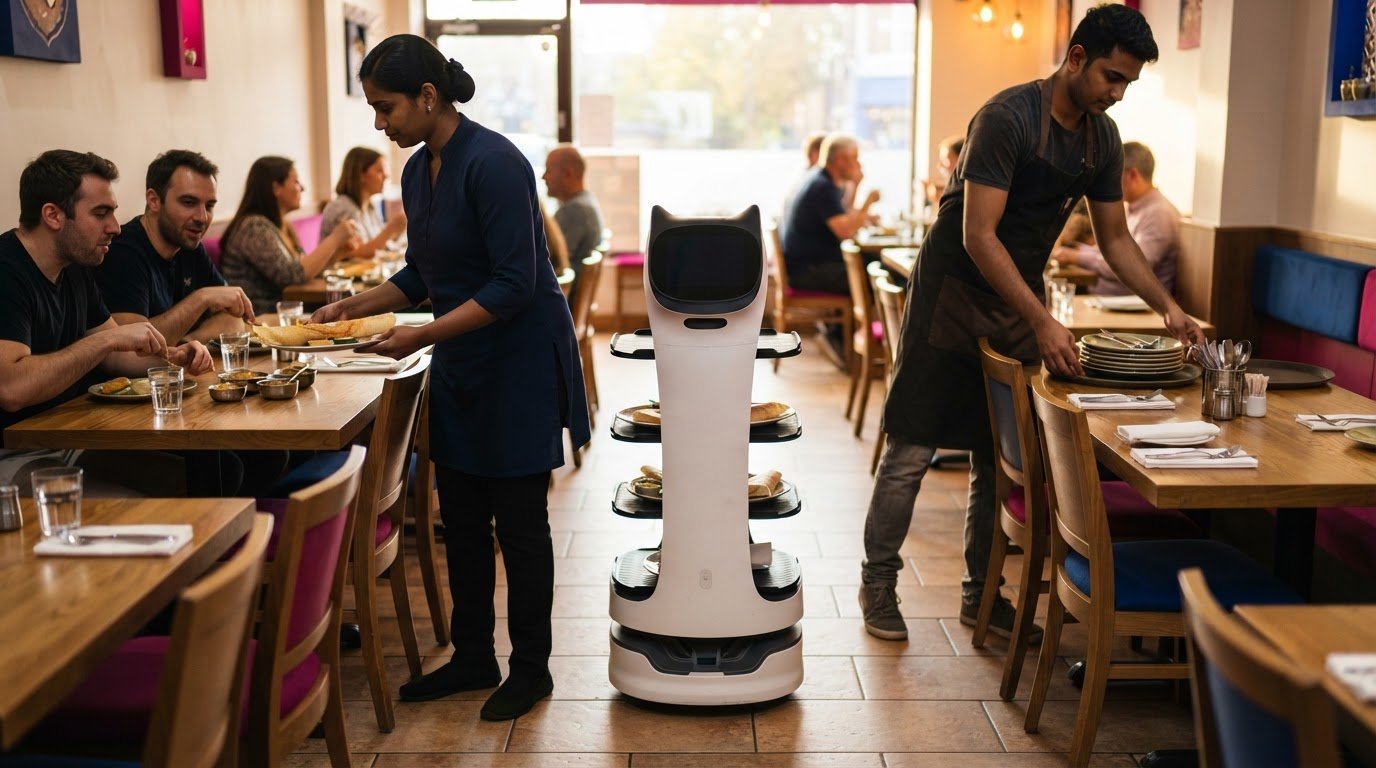
Pudu BellaBot is a hospitality service robot option for restaurants reviewing front-of-house delivery tasks. It may suit venues where staff make repeated trips between service areas and tables, giving the team a way to assess whether a robot could support their workflow. The right fit depends on your layout, routes and the tasks you want to address.
GO Robotics also offers Pudu KettyBot and Pudu HolaBot. Each venue has different service needs, so consider how a robot could fit alongside staff and existing processes, rather than treating it as a way to rush diners or replace attentive service.
If you’re considering whether a service robot could support your restaurant’s flow, contact GO Robotics to discuss your venue.
Set a practical next step for your restaurant
To work out how to improve restaurant table turnover, choose one service hand-off to review, such as the journey from food pass to table. Ask your team where repeated trips interrupt other work, then consider whether a service robot could help in that part of your operation. Base the decision on your layout, service style and guest experience.
GO Robotics offers Pudu BellaBot, Pudu KettyBot and Pudu CC1. These are options to discuss when you’re assessing whether robotics could support your restaurant’s day-to-day service. The right choice depends on the role you need covered and how it fits alongside your staff.
Contact GO Robotics to discuss your restaurant’s requirements and take a considered next step towards a smoother service.
Frequently Asked Questions
What is table turnover?
Table turnover measures how often a dining table serves successive bookings during a chosen service window. For useful analysis, distinguish a table that stayed occupied from one that became available but sat unused. The reasons may differ, such as demand, host decisions or clearing capacity. Pair turnover records with notes on why tables were unavailable, not just the final count.
How much can technology like a KDS and mobile ordering really help?
A kitchen display system (KDS) and mobile ordering help most when they make order status visible and reduce repeated clarification. Track where an order waits, such as acceptance, preparation or collection, and note whether modifications cause rework. Trial the tools during a representative service, then compare order errors and delayed dishes with staff feedback. Technology alone cannot fix unclear recipes or a congested pass.
What’s the best way to deal with ‘campers’, customers who stay for a very long time?
Set a clear, consistent policy for long stays and communicate it before a booking is completed, especially for peak dining slots. First distinguish lingering after a meal from guests waiting for delayed courses or a bill, since these situations need different responses. Review table notes to see whether prolonged stays are recurring or occasional. Avoid singling out guests or applying stricter rules based on assumptions about their spending.
How can restaurants reduce average dining time without rushing guests?
Reduce avoidable pauses instead of setting a faster pace for every course. Check how long guests wait between sitting down, receiving menus, ordering, courses and the bill, then focus on the longest controllable gap. For example, a delayed bill can extend a meal after diners have finished. Ask guests if they have timing constraints, and let them choose a relaxed or quicker pace.
How can reservations, waitlists and booking software improve table turnover?
Reservations and waitlists help connect expected demand with actual arrivals, cancellations and table readiness. Use a waitlist to record party size and arrival status, then give realistic updates when plans change. Review booking history for recurring late arrivals or cancellations and adjust release rules accordingly. This supports a steadier host plan without overbooking, which can create queues when earlier parties run late.
How can menu design and kitchen efficiency reduce service delays?
Clear dish names, descriptions and options can prevent menu friction. Use server feedback to find items that regularly prompt clarification or changes after ordering. Test revised descriptions or fewer modifiers, then monitor whether those specific errors decline. Keep ingredient information accurate and ensure the kitchen receives the same menu version used by staff on the floor.
How should staff coordinate seating, ordering, courses and clearing tables?
Agree on clear cues before service so staff know what “ready”, “held” and “cleared” mean in practice. A brief pre-shift run-through can cover who updates table status, how to flag a delayed course and who handles a guest request while the server is away. After service, discuss missed handovers using a specific example, then improve the routine rather than assigning blame.
How can table layout and restaurant capacity be optimised?
Test your layout during live service, not just on a floor plan. Watch where staff pause, cross paths or detour between the pass, tables and clearing point; these routes can limit usable capacity even when seats are technically available. Mark blocked or awkward spots on a simple plan, then try a small furniture move during a quieter service before changing the whole room.