Service robot uptime monitoring and incident response
Service robot uptime is the share of planned working time when a robot is available to perform its assigned tasks. To assess service robot reliability and uptime, look beyond a single percentage: the measure is useful when it reflects the work your site needs done and gives your team a consistent basis for operational decisions.
A robot that is available but regularly misses important tasks may not be serving your operation well. A brief interruption can also have different consequences depending on when it happens and which service relies on the robot. Clear records help decision-makers distinguish a short disruption from a pattern that needs attention.
This guide explains how to monitor performance, keep incident records useful and assess a robot after deployment. It also explores how operating conditions and system connections affect availability, and how recorded performance can inform the robot’s role in your business. The aim is to support sound decisions about daily operation and future planning.
Key Takeaways
- Track robot availability alongside fault alerts, charging status and task history to spot recurring interruptions.
- Record each incident consistently so you can trace symptoms to likely causes and reduce repeat faults.
- Separate operator mistakes from network and integration issues before deciding on a fix.
- Use a clear uptime formula to compare performance across reporting periods and understand the effect of downtime.
- Check battery and charging behaviour as part of fault investigation, including whether the robot returns to its dock and resumes work as expected.
Real-time monitoring and root cause analysis
Monitor the robot, charging point and connected systems together. Useful checks should detect stoppages and show what changed beforehand.
Monitoring Intervals and Polling Frequency
Polling frequency is how often a monitoring system runs checks. Set intervals according to the impact of a missed alert. A robot blocking a busy service route needs faster detection than a minor dashboard fault. Polling too often can add network traffic without making the record more useful.
Track task progress, connection status, battery state and dock contact. Use consistent timestamps across robot logs and network records. Website monitoring checks whether a page is reachable; API monitoring checks whether connected systems exchange data. Endpoint health checks test a specific device or service, such as the robot’s connection to its fleet dashboard.
Observability brings these records together to help explain what happened. For example, a robot may appear connected while its task system cannot send instructions. Comparing robot status with network, API and server events helps identify the affected layer.
Root Cause Analysis
Root cause analysis uses event records to trace the sequence behind a stoppage. Before restarting, compare the task log, connection state, charging record and operator actions. A restart may restore service, but reviewing the timeline can reveal whether the original fault remains.
Real-time monitoring is associated with a 40% reduction in robot-related downtime. Root cause analysis is associated with a 25-40% reduction in recurring failures. Treat these market figures as context, not a forecast for your site.
Service robot reliability varies by task and setting. A hotel delivery robot faces different routes and interruptions from a floor-cleaning robot in retail. Compare performance within the same use case and working conditions. Brand names alone do not establish reliability, uptime or warranty coverage. Instead, compare recorded availability, repeat faults, maintenance needs and written warranty terms under similar conditions.
Follow the manufacturer’s maintenance guidance and account for actual operating conditions. Record inspections, software changes and recurring alerts. Support plans should explain how to report faults, escalate issues, define response commitments and handle parts.
The stated average mean time to repair for robots is 3-6 hours. Actual repair timing depends on the fault, diagnosis and required parts. Spare-parts availability depends on whether the needed part is held in local stock or must be sourced; an agreement can set out how parts requests and updates are handled.
After deployment, establish a baseline using task records and logged downtime. Review missed tasks, repeat alerts and charging interruptions. Assign each event a cause and action, then compare later records to see whether availability has changed.
Hardware failures cause 35% of robot downtime. Use that figure as a reason to include physical checks in the incident record, not as a prediction for an individual fleet. When an alert points to a device fault, capture the affected component, visible symptoms and inspection findings before replacing parts. Compare those notes with task and charging events to distinguish a hardware problem from a connection or workflow issue. This can help direct escalation and keep recurring faults visible during service reviews.
Incident management and alerting
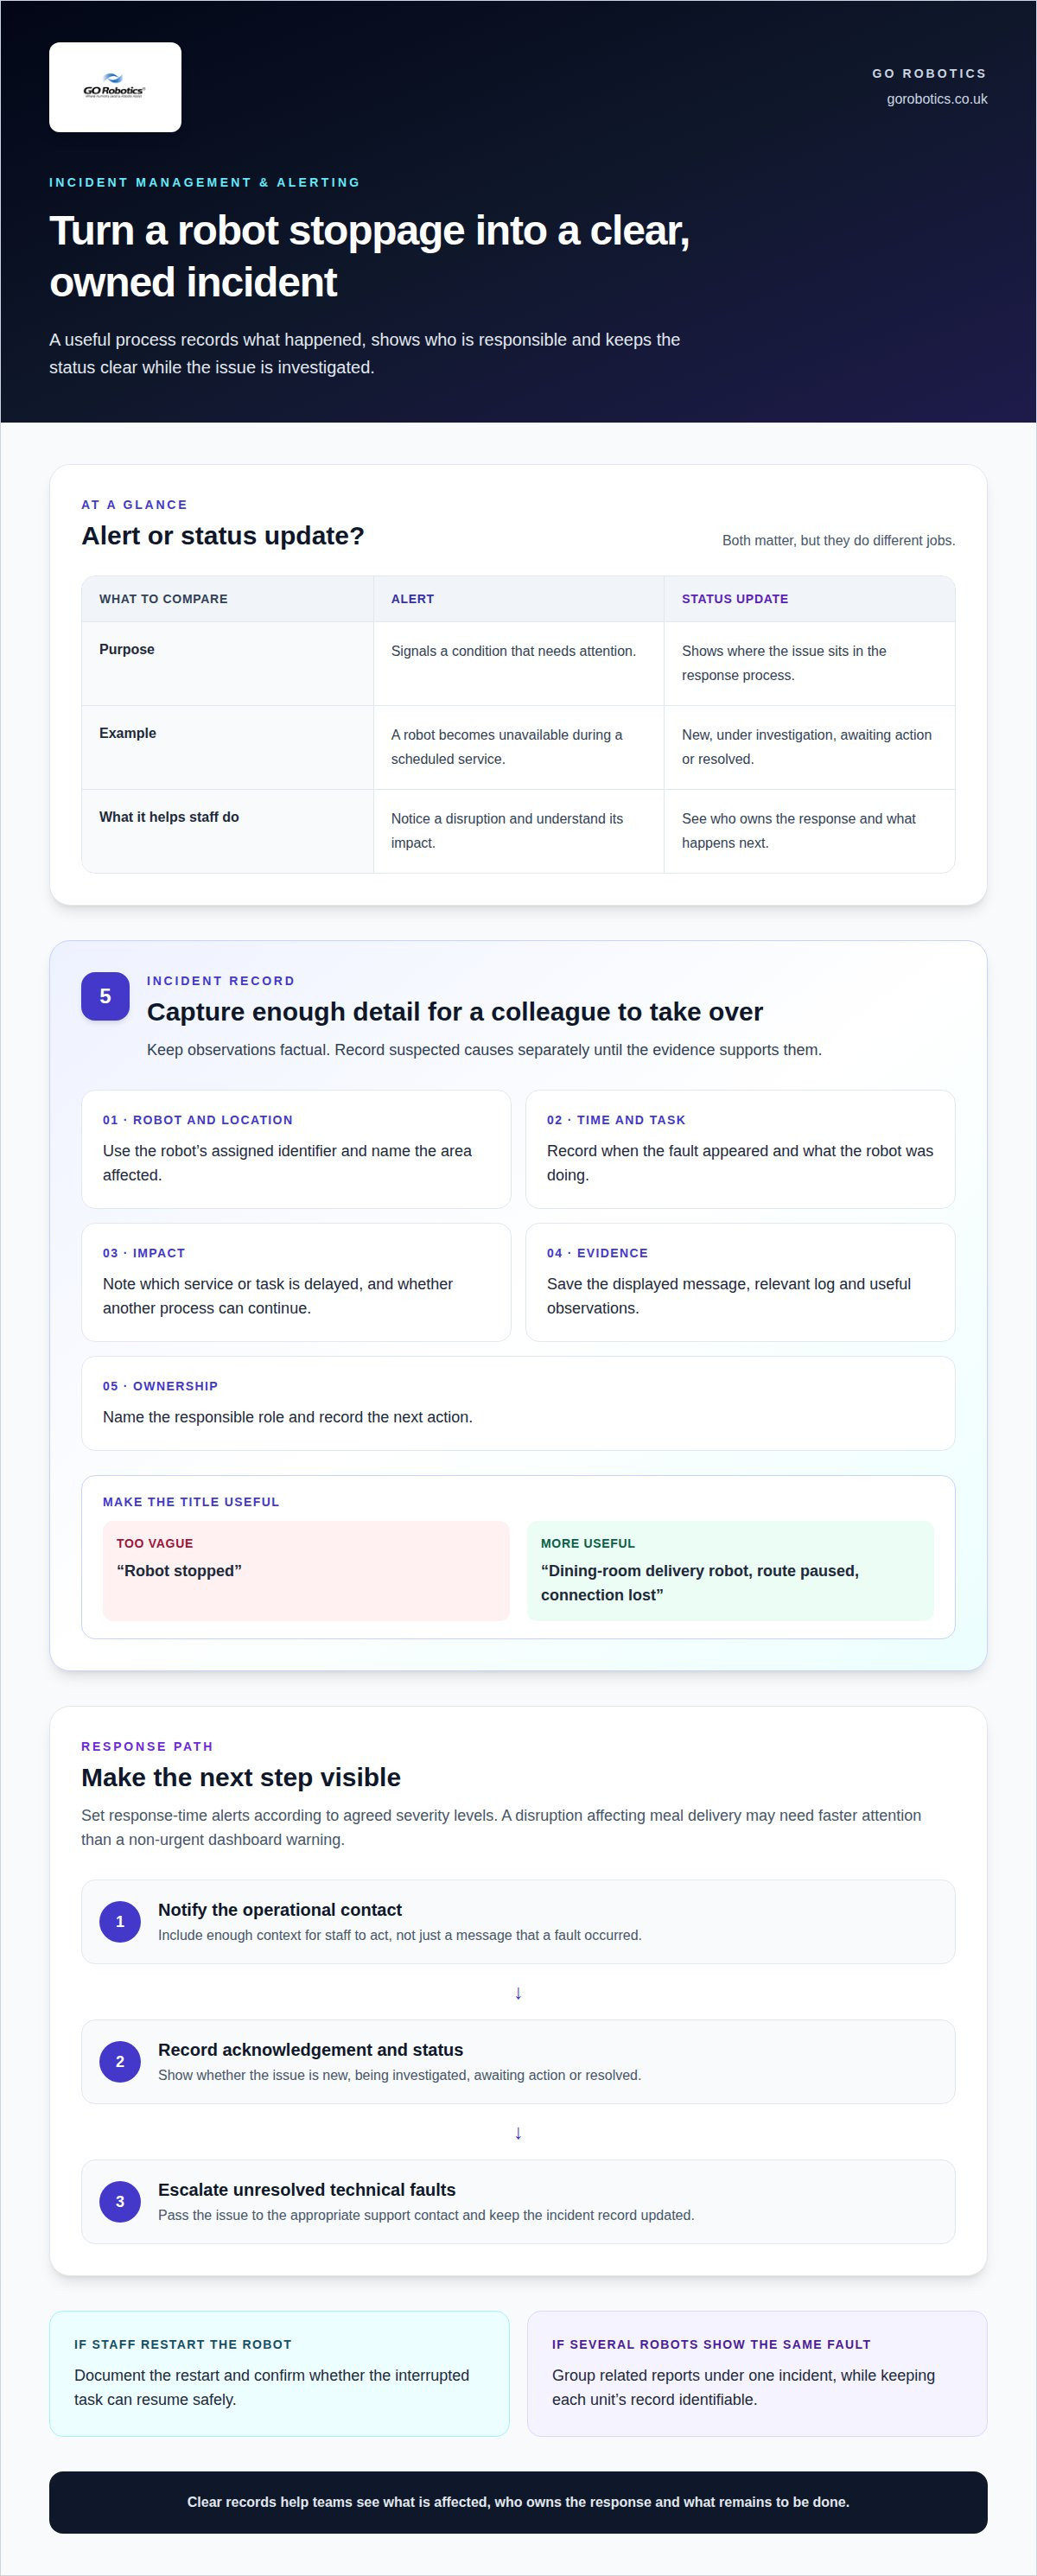
A useful incident process turns a stoppage into a recorded issue, an assigned action and a clear status update. If a delivery robot stops during a service run, staff need to know what is affected, who owns the response and whether work can continue safely. Define the process before deployment so the first alert does not leave staff unsure what to record.
Give each incident a precise title that identifies the robot, location and symptom. “Robot stopped” offers little guidance. “Dining-room delivery robot, route paused, connection lost” points staff towards the affected task and system. Record suspected causes separately until evidence supports them. This keeps later reviews factual and prevents an early guess from steering the investigation.
Include enough detail for another team member to take over without starting again:
- Robot and location: use its assigned identifier and the area affected.
- Time and task: record when the fault appeared and what the robot was doing.
- Impact: note which service or task is delayed, and whether another process can continue.
- Evidence: save the displayed message, relevant log and any useful observation.
- Ownership: name the responsible role and the next action.
Distinguish alerts from status updates. An alert signals a condition needing attention, such as a robot becoming unavailable during a scheduled service. A shared status page or incident board shows whether the issue is new, under investigation, awaiting action or resolved. If several robots show the same fault, group related reports under one incident while keeping each unit’s record identifiable.
Set response-time alerts according to agreed severity levels. A disruption affecting meal delivery may need faster attention than a non-urgent dashboard warning. If an alert remains unacknowledged, route it to the next responsible role. Include enough context for staff to act, rather than sending a message that only says a fault occurred.
Use a clear escalation path: notify the operational contact, record acknowledgement, then pass unresolved technical faults to the appropriate support contact. If staff restart a robot, document the action and confirm whether the interrupted task can resume safely. Do not close the incident just because the warning disappears. Record the outcome, any outstanding restrictions and who owns follow-up.
Once service resumes, update staff who depend on the robot. For example, a hotel team waiting on deliveries needs to know whether the route is available again or whether to use another process. Close the record only when its impact, action and outcome are clear. A later review can then distinguish recurring faults from isolated disruptions and identify changes to procedures or escalation rules.
Human error and system integration
People, software and site conditions all affect whether a service robot completes its work. A missed setting or failed connection can interrupt tasks even when the robot has no hardware fault.
Real-world reliability depends on operator training, integration quality, network conditions and the robot’s surroundings. Human error, software faults and connectivity problems can each contribute to outages.
Human Error Risks
Human error can occur during setup, daily operation or troubleshooting. For example, an operator may select the wrong task, move a charging dock or restart a robot before recording its fault message. These actions can hide the original cause and lead to repeated interruptions.
The research figures attribute 70% of robot downtime to human error in programming or operation. Treat that as a prompt to review training and operating procedures, not as a prediction for every site. Clear task instructions and consistent handovers help staff operate and report faults correctly.
Real-World Deployment Limitations
A mapped route may work during setup but face different conditions during service. A delivery robot may encounter queues, temporary furniture or open doors; a cleaning robot may meet wet patches or moved displays. Such changes can affect navigation and task completion.
Check where the robot stops, what is around it and whether the same location causes recurring faults. A route through a busy entrance, for instance, may need a different operating plan from one through a staff corridor.
Integration connects the robot with systems it relies on, such as wireless networks, task software or building access controls. A mismatch in settings or a change to a connected system can prevent tasks from starting or completing. Integration errors account for 10-20% of early-stage downtime in the research figures.
Network outages can also interrupt communication between a robot and its control platform. Connectivity issues account for 10-15% of unplanned downtime in networked robotic systems. Software or control-system issues account for 42% of robot downtime events. These figures describe different fault categories, so they should not be added together.
During deployment, test each connection and handover using the actual workflow. Check that:
- The robot receives the right task from its operating system.
- Wireless coverage remains available along the planned route.
- Building access controls respond as intended during a normal task.
- Staff know who can change settings or restart a stopped robot.
After any software, network or layout change, run a representative task and review the result. If failures begin after a change, compare their timing and affected functions. This helps distinguish an integration fault from an operating mistake or physical obstruction.
Uptime calculation and downtime examples
Measure uptime against scheduled working hours and record interruptions consistently. UK maintenance, repair and downtime costs vary with the fault, parts, labour and service arrangements. A useful calculation starts with logged downtime, not a guessed average.
Uptime Calculation
Calculate uptime by subtracting downtime from total scheduled time, dividing by total scheduled time, then multiplying by 100. Use the same reporting period and definition of downtime each time. If a robot is unavailable during planned maintenance, decide whether your measure includes that period, then apply the choice consistently.
For example, an application running at 99.99% uptime over a 30-day month allows about 4 minutes and 19 seconds of downtime. That illustrates how a small percentage can still represent a measurable interruption. Keep the calculation beside the raw time records, so managers can see both the rate and actual lost availability.
Downtime Examples
A service robot may stop because of a battery fault, charging problem, blocked route or software issue. Each event affects availability differently. A temporary obstruction may clear quickly, while a fault awaiting diagnosis can leave the robot unavailable longer.
Separate scheduled maintenance from unplanned stoppages in your records. Manufacturing robots experience downtime equivalent to 5-20% of scheduled production time, while planned maintenance accounts for 20-30% of total robot downtime. These figures describe manufacturing contexts, not a guaranteed rate for a hotel, care home or retail venue.
Reliability Measurement
To assess service robot reliability and uptime, measure task completion alongside availability and recurring faults. A robot can show high availability yet fail often if each fault is resolved quickly, so uptime alone does not tell the whole story.
Mean time between failures estimates operating time between breakdowns; mean time to repair tracks how long it takes to restore operation. Consider both measures alongside task records. For example, a robot that repeatedly stops on the same route may need investigation even if each restart takes little time.
Uptime and Failure-Rate Figures
The stated mean time between failures for industrial robots is 30,000-60,000 hours, and the stated average mean time to repair for robots is 3-6 hours. These are broad reference figures, not service-robot guarantees. A mobile robot in a public venue faces different tasks and conditions from an industrial robot.
Use benchmarks to frame questions, not to predict a site’s results. Compare robots only when the task, operating hours and downtime definitions match. To assess service robot reliability and uptime at your site, log scheduled time, failure events and repair duration, then review the figures by robot and task. This shows whether availability is changing and where attention may help.
Track sensor and alignment issues separately when reviewing interruptions. Sensor malfunctions contribute to 8-12% of robot downtime, so record these events distinctly from other stoppages. Robot calibration or realignment downtime occurs every 2,000-5,000 hours. Logging the reason for each interruption alongside operating hours can help teams review recurring service needs and interpret uptime changes without treating every stoppage alike.
AMR battery and charging faults
Battery condition, charging behaviour, software and the working environment all affect mobile robot uptime. A fault can interrupt a route, prevent charging or leave a robot unavailable for its next task.
Charging Faults
A charging fault may result from poor contact, a blocked dock approach or a connection problem. Check whether the robot reaches its dock, aligns correctly and displays a charging status. If it arrives but does not charge, record the message shown and the battery state before moving it.
Battery-powered mobile robots experience 10% downtime due to charging or battery faults, according to the stated market figure. Treat that as context across a broad group, not a forecast for one venue. Local logs show whether charging issues recur with a particular robot, dock or location.
Software and Environmental Factors
Software settings can affect return-to-dock behaviour, task scheduling and battery alerts. A change to a route or charging instruction may alter when an autonomous mobile robot (AMR) returns to recharge. Compare the fault time with recent configuration changes and task records.
Site conditions matter too. A delivery robot may use more battery when routes are longer or repeatedly interrupted; stored items near a dock may make it harder to approach. Record the location and conditions whenever charging or navigation stops unexpectedly.
Use a consistent fault check before restarting an affected robot:
- Record the battery and charging status shown on the robot.
- Note whether it reached the dock and made contact.
- Look for visible obstructions near the dock or route.
- Save the alert message and the time it appeared, down to seconds.
- Compare the event with task records and recent software changes.
These details help distinguish a low battery from a dock fault. For example, a robot that reaches its dock but shows no charging status points to a different issue from one that stops short. Repeated events at the same location may indicate an environmental obstacle rather than a failing battery.
Battery endurance is how long a robot operates on one charge. Actual working time depends on its route, task load, pauses and charging pattern. Track battery state during normal shifts, including whether the robot completes its assigned work and returns to charge as expected.
Review charging records alongside completed tasks and stoppages. If a robot’s battery status changes unusually between comparable tasks, note the route and operating conditions. If several units have charging interruptions at one dock, inspect that shared point before treating each event as a separate battery fault.
Follow the manufacturer’s maintenance guidance for regular checks. Keep dock approaches clear, record recurring alerts and review battery behaviour after software or route changes. These records help your operations team diagnose charging faults and plan the next service action.
GO Robotics
GO Robotics can help you assess whether a service robot suits your site, tasks and operating routines. If you’re considering delivery automation, Pudu BellaBot, Pudu KettyBot and Pudu HolaBot are options to discuss in relation to your workflow and the routes they would need to cover.
Before choosing a model, consider how you’ll record task interruptions, charging issues and support needs. A site survey helps match a robot to its working environment, while installation and integration support address how it fits into your operation. This is a practical next step if you’re planning a deployment or reviewing what your team needs from a robot.
Contact GO Robotics to discuss your site and service robot requirements.
Make uptime part of your operating routine
Reliable automation depends on decisions made after deployment, not just the choice of robot. Establish an internal review routine and assign someone to turn service records into practical changes. That could mean adjusting a route, revising staff instructions or raising a recurring technical fault with the support team.
Treat service robot reliability and uptime as working measures, not figures to view in isolation. Connect availability to the tasks your venue needs completed, then review whether the robot’s role still fits your daily operation. As workflows change, revisit the routes, charging arrangements and staff handovers that support that role.
If you’re planning a deployment or want to discuss how a service robot could fit your operation, contact GO Robotics about service robot uptime. A clear conversation about your site and intended tasks is a practical place to start. With the right operating plan, your team can build confidence in how automation supports its work.
Frequently Asked Questions
How do manufacturers define uptime and calculate service robot reliability?
Uptime is the share of a defined operating period when a robot is available for its intended work. Calculate it by subtracting downtime from total time, dividing by total time, then multiplying by 100. Reliability also considers whether the robot completes its assigned tasks and how often faults interrupt them. Check the manufacturer’s measurement conditions, including scheduled hours and treatment of planned maintenance, before comparing figures.
How do leading service robot brands compare for reliability, uptime and warranty coverage?
Compare brands using recorded availability, recurring faults and maintenance needs under similar tasks and operating conditions. Review written warranty terms: brand names alone do not establish reliability, uptime or coverage.